PulseGrid
A parametric market intelligence platform that correlates global events with financial instruments to produce transparent, evidence-based analysis using the PG-MIM (PulseGrid Market Impact Model).
THIS PLATFORM AND ALL DATA, SCORES, ANALYSES, RECOMMENDATIONS, AND OUTPUTS GENERATED HEREIN ARE PRESENTED SOLELY AS AN ACADEMIC PROPOSITION AND FOR INFORMATIONAL AND EDUCATIONAL PURPOSES ONLY.
Nothing on this platform constitutes financial advice, investment advice, trading advice, or any other form of professional advice. The PulseGrid platform, its PG-MIM (PulseGrid Market Impact Model) scoring engine, and all derived data, outputs, visualizations, scenario simulations, historical replays, and AI-generated analyses are not intended to be, and shall not be construed as, a recommendation to buy, sell, hold, or otherwise transact in any security, commodity, currency, cryptocurrency, derivative, or any other financial instrument.
All risks are borne solely and exclusively by the user. By accessing and using this platform, you acknowledge and agree that:
- You are solely responsible for your own investment decisions and any consequences thereof. TRAYAZ, LLC, its affiliates, officers, directors, employees, agents, and licensors shall not be liable for any losses, damages, or costs arising from your reliance on any information provided by this platform.
- The scores, predictions, and analyses generated by the PG-MIM model are based on mathematical algorithms applied to publicly available data and are inherently uncertain. Past performance, whether actual or simulated through historical replay, is not indicative of future results.
- The platform may contain errors, inaccuracies, or omissions. Data sourced from third-party providers (including but not limited to market data feeds, news sources, and economic indicators) may be delayed, incomplete, or inaccurate.
- No representation or warranty, express or implied, is made regarding the accuracy, completeness, reliability, suitability, or availability of the platform or the information, products, services, or related graphics contained on the platform for any purpose.
- You should consult with a qualified, licensed financial advisor before making any investment decisions. This platform does not provide personalized investment advice and does not take into account your individual financial circumstances, risk tolerance, or investment objectives.
- The use of artificial intelligence and large language models (LLMs) for event classification, sentiment analysis, and copilot reasoning introduces additional uncertainty. AI-generated content may contain hallucinations, biases, or errors.
BY USING THIS PLATFORM, YOU EXPRESSLY ACKNOWLEDGE THAT YOU HAVE READ, UNDERSTOOD, AND AGREE TO BE BOUND BY THIS DISCLAIMER. IF YOU DO NOT AGREE WITH ANY PART OF THIS DISCLAIMER, YOU MUST IMMEDIATELY CEASE USING THE PLATFORM.
This disclaimer is governed by and construed in accordance with the laws of the United States. Any disputes arising out of or in connection with this disclaimer shall be subject to the exclusive jurisdiction of the courts of the United States.
The PG-MIM Algorithm
The PulseGrid Market Impact Model (PG-MIM) is a parametric engine that produces explainable market intelligence. It correlates global events with financial instruments through a structured, multi-dimensional scoring framework. The model's core philosophy is that a system that cannot explain the past has no business forecasting the future.
| Category | Sub-Category | Examples |
|---|---|---|
| Market | Price & Volume | Price, Volatility, Volume, VWAP, Bid-Ask Spread |
| Momentum | RSI, Moving Averages, Sector Momentum | |
| Liquidity | Market Depth, Order Book Imbalance | |
| Correlation | Cross-Asset, Inter-Market Correlation | |
| Macro | Economic Indicators | Interest Rates, CPI, GDP, Employment, PMI |
| Monetary Policy | Central Bank Announcements, QE/QT | |
| Commodities | Inventories (Oil, Gas, Metals), Production | |
| Event | Geopolitical | Elections, Sanctions, Military Actions, Trade Agreements |
| Supply Chain | Strikes, Weather, Cyber Incidents, Export Restrictions | |
| Corporate | M&A, Earnings, Product Launches, Leadership Changes | |
| Sentiment | News & Media | News Tone, Analyst Revisions, Source Credibility |
| Social Media | Amplification Factor, Keyword Trends | |
| Structural | Fundamentals | Revenue, Earnings, P/E, Debt-to-Equity |
| Geographic | Revenue by Region, Supply Chain Dependencies |
1. Event Impact Score (EIS)
Measures the intrinsic severity of an event as a function of its type, magnitude, and geographic scope.
EIS = Wtype × M × Gscope
Wtype (Event Type Weight): Predefined weight by category. Geopolitical = 0.9, Macro = 0.8, Supply Chain = 0.75, Corporate = 0.6, Sentiment = 0.5
M (Magnitude): Normalized score [0, 1] representing event scale
Gscope (Geographic Scope): Global = 1.0, Regional = 0.7, Local = 0.4
2. Exposure Score (ES)
Measures an instrument's sensitivity to a given event based on sector alignment, geographic revenue exposure, and supply chain dependencies.
ES = Esector × Egeo × Esupply
Esector (Sector Exposure): [0, 1] — How much the instrument's sector is affected by the event type
Egeo (Geographic Exposure): [0, 1] — Revenue fraction from the event's affected region
Esupply (Supply Chain Exposure): [0, 1] — Reliance on suppliers/customers in the affected area
3. Sentiment Shift Score (SSS)
Measures the change in market narrative surrounding an instrument, weighted by media amplification.
SSS = (ΔS) × Af = (Scurrent − Sprevious) × Af
Scurrent (Current Sentiment): [-1, 1] — Aggregate sentiment from news and social media
Sprevious (Previous Sentiment): [-1, 1] — Sentiment from the prior period
Af (Amplification Factor): Multiplier based on volume and velocity of mentions
4. Market Confirmation Score (MCS)
Measures whether the instrument's price action confirms the model's thesis through price trend and volume analysis.
MCS = Cprice × Cvolume
Cprice (Price Trend Confirmation): [0, 1] — High if price moves in the expected direction
Cvolume (Volume Confirmation): [0, 1] — High if price movement is accompanied by significant volume
5. Macro Compatibility Score (MaCS)
Measures alignment of the event's impact with the prevailing macroeconomic environment.
MaCS = ρ(Rinstrument, Fmacro)
ρ (Correlation): Statistical measure of the relationship between instrument returns and macro factors
Rinstrument: Instrument return series
Fmacro: Key macroeconomic factor (interest rates, inflation, etc.)
6. Uncertainty Score (US)
Quantifies the model's confidence in its prediction based on data quality and model fit.
US = 1 − (Qdata × Fmodel)
Qdata (Data Quality): [0, 1] — Quality and completeness of input data
Fmodel (Model Fit): [0, 1] — How well the current scenario fits historical patterns
Final Composite Score
The PulseGrid Score is the composite of all sub-scores, adjusted for uncertainty:
PG Score = (EIS × ES × SSS × MCS × MaCS) − US
The score is normalized to a range of [-100, +100], where:
-100 to -30
Strong Sell / Bearish
-30 to -10
Sell / Cautious
-10 to +10
Hold / Neutral
+10 to +100
Buy / Bullish
System Architecture
The following diagram illustrates the complete data flow from ingestion through scoring to output delivery. Each layer processes and enriches the data before passing it downstream.
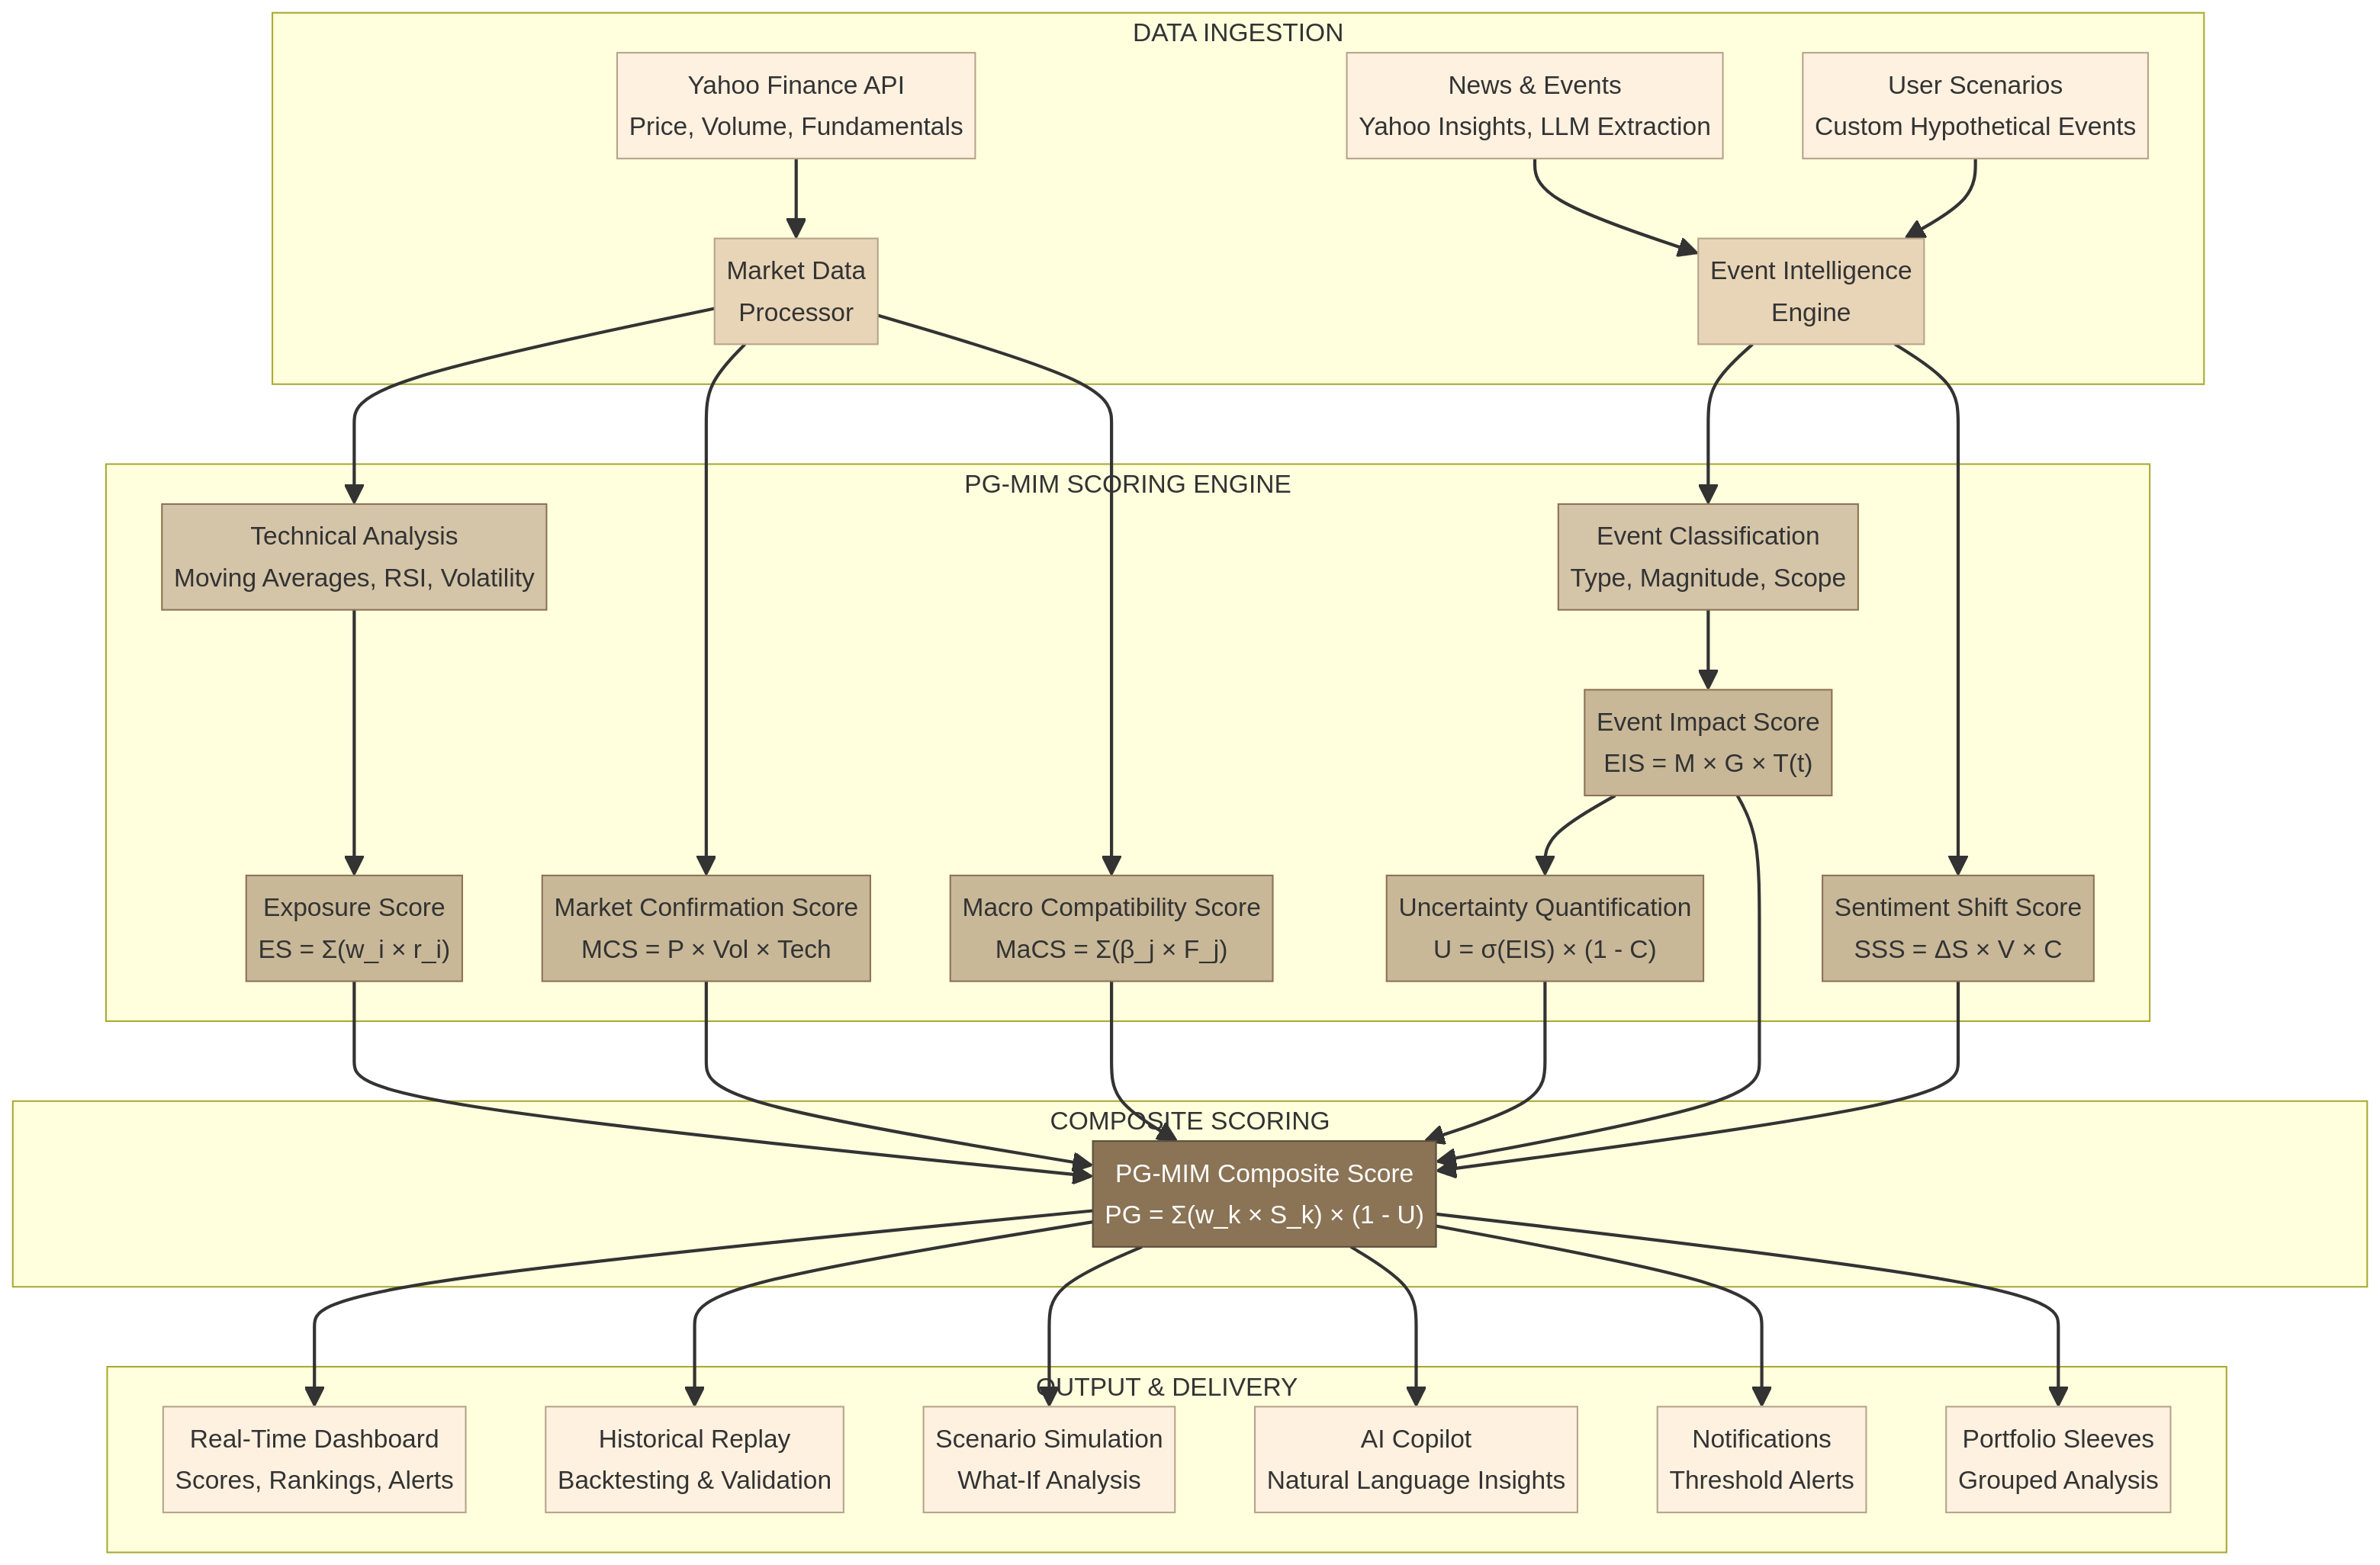
Data Ingestion Layer
Yahoo Finance API provides price, volume, and fundamentals. News sources and LLM extraction identify significant developments. User scenarios feed custom hypothetical events.
PG-MIM Scoring Engine
Six sub-scores (EIS, ES, SSS, MCS, MaCS, US) are computed from classified events and technical analysis, then combined into the composite PG Score.
Output and Delivery
Scores feed the real-time dashboard, historical replay, scenario simulation, AI copilot, notifications, and portfolio sleeves.